Supply chain and logistics functions have been one of the most volatile in the global economy of the last four years. The overall volatility was punctuated by shortages that were themselves brought about by the global COVID-19 pandemic. However, the immediate changes in consumption patterns and the subsequent “get out of the house” rebound were quickly followed by widespread inflation and the Ukraine war. But what about now? Do supply chain bottlenecks persist and if so, where? Is supply chain resilience still a priority for C-level executives? Or have these concerns been replaced with cost-price inflation and compressed profit margins? These are questions ARC Advisory Group will seek to answer in our online survey research of supply chain executives over the next few months. But for now, let’s take a look at the most recent and relevant macroeconomic indicators to look for insights. I’ll begin with a macro historical view and then look at indicators that tend to be more specific and potentially more leading than coinciding with economic activity.
Source: J.P. Global Manufacturing PMI
Global Trade as a Barometer
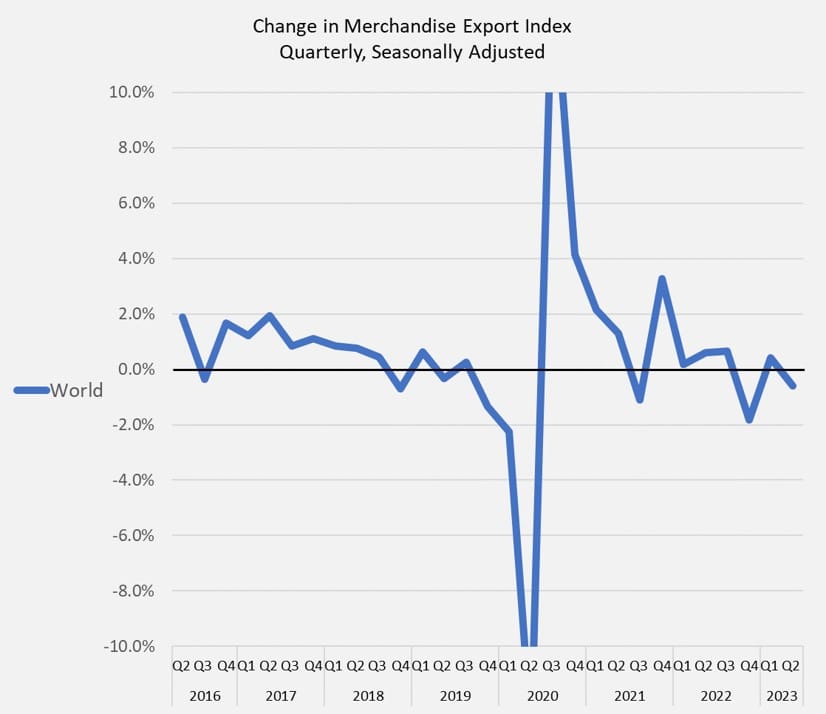
Clearly domestic business activity is much larger than international trade. But cross-border trade is an important part of the global economy and much of this trade is in physical goods that must be stored, shipped, transported, and eventually consumed. The World Trade Organization publishes lots of insightful data on global trade – including trade indexes. I decided to take a look at quarterly changes in worldwide merchandise export volumes from 2016 to 2023. The first pattern I noticed was an extreme decrease followed by an extreme increase in 2020. The second pattern that jumps out is an ongoing reduction in volatility of change. I see that as a positive. The third trend is that global trade growth appears to be gradually slowing. I don’t see that as a positive. I also looked at changes in exports by the US, Europe, and China. The major takeaway is that there is little insight gained from this additional breakdown, except for maybe a more recent slowdown and amplified return to growth from China exports.
The United States publishes monthly advance economic indicators that can provide more recent and updated information. The report for August (released in late September) shows negligible changes in the aggregate. However, imports of industrial supplies appear to be declining. I believe this category is worth watching to see if it rebounds.
Manufacturing Purchasing Managers Indexes
The J.P. Morgan Global Manufacturing PMI compiles data from S&P Global and other sources from countries across the globe and weighs the countries based on annual manufacturing value added. Overall, the global index showed September activity to be deteriorating at a slow rate. Future output indicates expectations for growth along with better sentiment. Output rose in 8 of the 29 nations for which data was available. However, China and the US were among the 8 countries where output increased. In contrast, the overall manufacturing PMI for the Eurozone was quite weak with Germany and Austria reporting the lowest levels. The HCOB Eurozone PMI provides some insights into the trend and the performance of nations within the Eurozone but leaves little in the way of insights into drivers and mechanisms for a turn-around. The HCOB Germany PMI, which registered 39.6 in September, provided some dynamics behind the numbers stating, “reports from surveyed businesses highlighted a number of headwinds to demand, including customer uncertainty, widespread efforts to reduce stocks and weakness in construction activity.” My impression from reviewing the PMI press releases is that manufacturing sluggishness is widespread across industries and sectors, but regional differences are notable.
The GEP Global Supply Chain Volatility Index, published in partnership between GEP and S&P Global, states that the downturn in global demand for commodities and raw materials is stabilizing, Europe is by far the globe’s biggest weak spot, excess capacity across North American supply chains increased by the smallest margin since April, and Asian suppliers reported greater spare capacity for the first time since July. The decline in transportation costs reduces the volatility index reading but is surely a positive for shippers. Perhaps most notable is the substantial decline in container shipping rates. Together these statements reinforce the narrative that activity in Europe is weak, while activity in the US and Asia are generally stable.
Final Word
Price fluctuations tend to be determined on the margin due to supply and demand imbalances. Therefore, the decline in shipping rates should not be mistaken for an equivalent change in economic activity. However, there are notable weaknesses in economic activity levels. However, regional differences are notable. Furthermore, aggregate trade remains stable but I plan to seek out greater details into activity within specific industries, goods, and processes.
The post How is the Logistics Economy Holding Up? appeared first on Logistics Viewpoints.