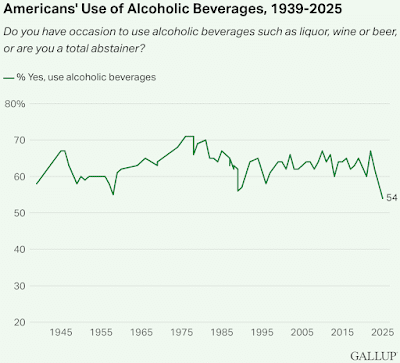
We have all read warnings about declining wine consumption over recent years, especially in the USA. There are a few things about this situation that are worth summarizing here, based on recent reports from the national Gallup survey organization’s Latest Insights into alcohol consumption (eg. U.S. drinking rate at new low as alcohol concerns surge). First, let us make it clear what we mean by declining alcohol consumption. Gallup summarizes U.S. alcohol usage since 1939 as in this first graph. Note that it is clear that usage was fairly consistent from roughly 1980 through to 2020, but that it has decreased notably over the past half-decade. We can now take a look at which parts of the previously drinking population are estimated to have recently stopped drinking (between 2023 and 2025). This table summarizes my calculations from the Gallup data. Recent trend in percentages of U.S. adults who report they drink alcohol, by subgroup All U.S. adults 12.9 Gender Men 8.0 Women 17.1 Race/Ethnicity White adults 17.9 People of color 3.7 Age 18 to 34 15.3 35 to 54 15.2 55 and older 8.2 Annual household income less than 40.000 25.9 40.000—99.999 6.9 100.000 or more 16.5 Party ID Republicans 29.2 Independents 9.8 Democrats 4.7 You may make of these numbers what you will, especially with regard to White, Female, Poor, Republicans. It is clear that only a subset of adults have decreased their alcohol consumption, but it is not a small subset. The often-given reason for these declines has to do with changing perception, over the past decade, of the health effects of alcohol. This situation is summarized in this next graph, also from Gallup. Those people who think that even moderate alcohol consumption is bad now out-number even those who think that it makes no difference (let alone think it is good for you!). I have discussed this latter topic in more detail in a recent blog post (WHO has an unattainable requirement for health and wine).